You Can Now Exercise Multiple Times A Day. But, Should You?
There has been a rapid rise in the number of runners during the lockdown and now restrictions on the frequency of exercising have been lifted. Will you run more frequently or even twice in one day? How will you monitor this and how will you reduce your risk of injury?

With exercise restrictions lifted by the government there is opportunity for more varied forms of exercise and an increased, unlimited frequency. You may be looking to run more regularly or incorporate other forms of exercise that have been limited by the initial restrictions. Some individuals may be looking to return to more team based sporting goals which involve very differing demands on the body. With these increased opportunities comes risk of injury. So, how can we control and reduce the risk? Working out your Acute vs Chronic Workload Ratio may be the key.
Acute vs Chronic Workload Ratio is a monitoring tool widely utilised within the professional sporting world and although its implementation was widespread due to a few key articles and opinion pieces, it does lack robust evidence to support its claims. More recently there have been arguments for and against its claims of reducing the risk of injury and its effectiveness in adequately monitoring athletes workloads. Personally, I use it to guide athletes and clients on their return to exercise after an injury or to help explain why their training errors may have led to an injury.
The Acute vs Chronic Workload Ratio can be applied to multiple data sets but for ease of explanation we will initially discuss running distances. Your chronic workload is the average distance ran over the last 4-weeks. The acute workload is the distance covered or that you plan to cover in 1-week. The ratio is calculated by dividing the acute workload by the chronic workload.

Using the example above we have a weekly average of 20km (chronic, week 1-4) but a planned increase for week 5 of 30km (acute). This would result in an Acute vs Chronic Workload Ratio of 1.5. A 20km to 30km increase in running distance across a week does not sound drastic but what does a workload ratio of 1.5 represent?
According to the Acute vs Chronic Workload Ratio;
< 0.80 (Under training and higher relative injury risk)
80 – 1.30 (Optimal workload and lowest relative injury risk – “The Sweet Spot”)
> 1.50 (The “danger zone” and highest relative injury risk)
It is suggested that spikes in acute workload above chronic workload are indicative of increased risk of injury. The modest increase from 20km to 30km in total running distance produces a large spike in workload correlating to the danger zone with a potential of a high risk of injury. With a small change to week 5, replacing two of the 10km runs with 8km runs would result in a workload ratio of 1.3 and in theory could reduce the risk of injury and thus hitting ‘The Sweet Spot’.

In relation to this workload ratio, “The Sweet Spot” may offer progressions in fitness or performance with a reduced risk of injury.
Previous blogs on this site have highlighted that many injuries are linked to training error (read here). We have also talked about how too much too soon can cause injury. Therefore, could you use the acute vs chronic workload ratio to plan and periodise your training loads? Further to this can we link all of the information regarding training errors and reducing injury?
Simple Acute vs Chronic Workload Ratio Suggestion
Average your last 4-weeks of running mileage
Plan you next week of training
Divide your planned weekly mileage by the average of your previous 4-weeks mileage
If you are between 1.1-1.3 then you are hitting “The Sweet Spot”
Aim to progress for 3-weeks at 1.1-1.3 workload ratio
Then reduce to 0.9-1.1 for 2-weeks before looking to progress your mileage again
Personally, I feel the Acute vs Chronic Workload Ratio has its limitations. It lacks robust evidence to support its views and the statistical formulae used have their limitations, by averaging data you lose the variance and influence the standard deviation. For example, a week containing only one run could equal that of another with 4x runs even though the demands of each run would be very different. In relation to running, there is so much more that influences fatigue and workload across a week that the ratio doesn’t consider. The above example is a rolling average model. It suggests that each week or workload in an acute or chronic period is equal. If we only use mileage and running loads we ignore that not all runs, irrespective of their distance, are equal. Effort levels within a 5km run can be very different or how fatigued you feel on any given day can be influenced by a variety of other factors.
The above model does not consider other forms of exercise away from running. In relation to injury risk, strength training has long been supported and linked to reducing the risk so how do we include this in our acute vs chronic workload ratio? If you are running, you should be strength training (read here). Therefore, to include more factors we first need to have a greater understanding of the acute vs chronic workload.
The workload ratio model is not new. The model was originally generated to consider how well prepared an athlete was for performance. Previous models superseded acute and chronic with fatigue and fitness:
Acute workload represented fatigue
Chronic workload represented fitness
If fitness is greater than fatigue then the athlete is considered to be a physical state where they could produce a good performance. Conversely, if fatigue is greater than fitness then the athletes performance will suffer. As discussed previously, if we are truly looking to influence the risk of running related injuries we must consider strength training. With strength training comes fatigue and if the level of fatigue outweighs our fitness or, in other words, the acute workload is greater than our chronic workload we are increasing our risk of injury. So, how do we include strength training sessions and other influencers of fatigues in our acute vs chronic workload ratio?
To incorporate strength training we can use the time spent strength training and the perceived exertion scale (Borg Scale 6-20). It is a common method for calculating workload by multiplying the session-rating of perceived exertion by session duration. Thus, if you train at an 8/10 perceived exertion for 60 minutes, the workload in arbitrary units (au) would be 480au. Arbitrary units can be used for many training factors, which will be demonstrated below.
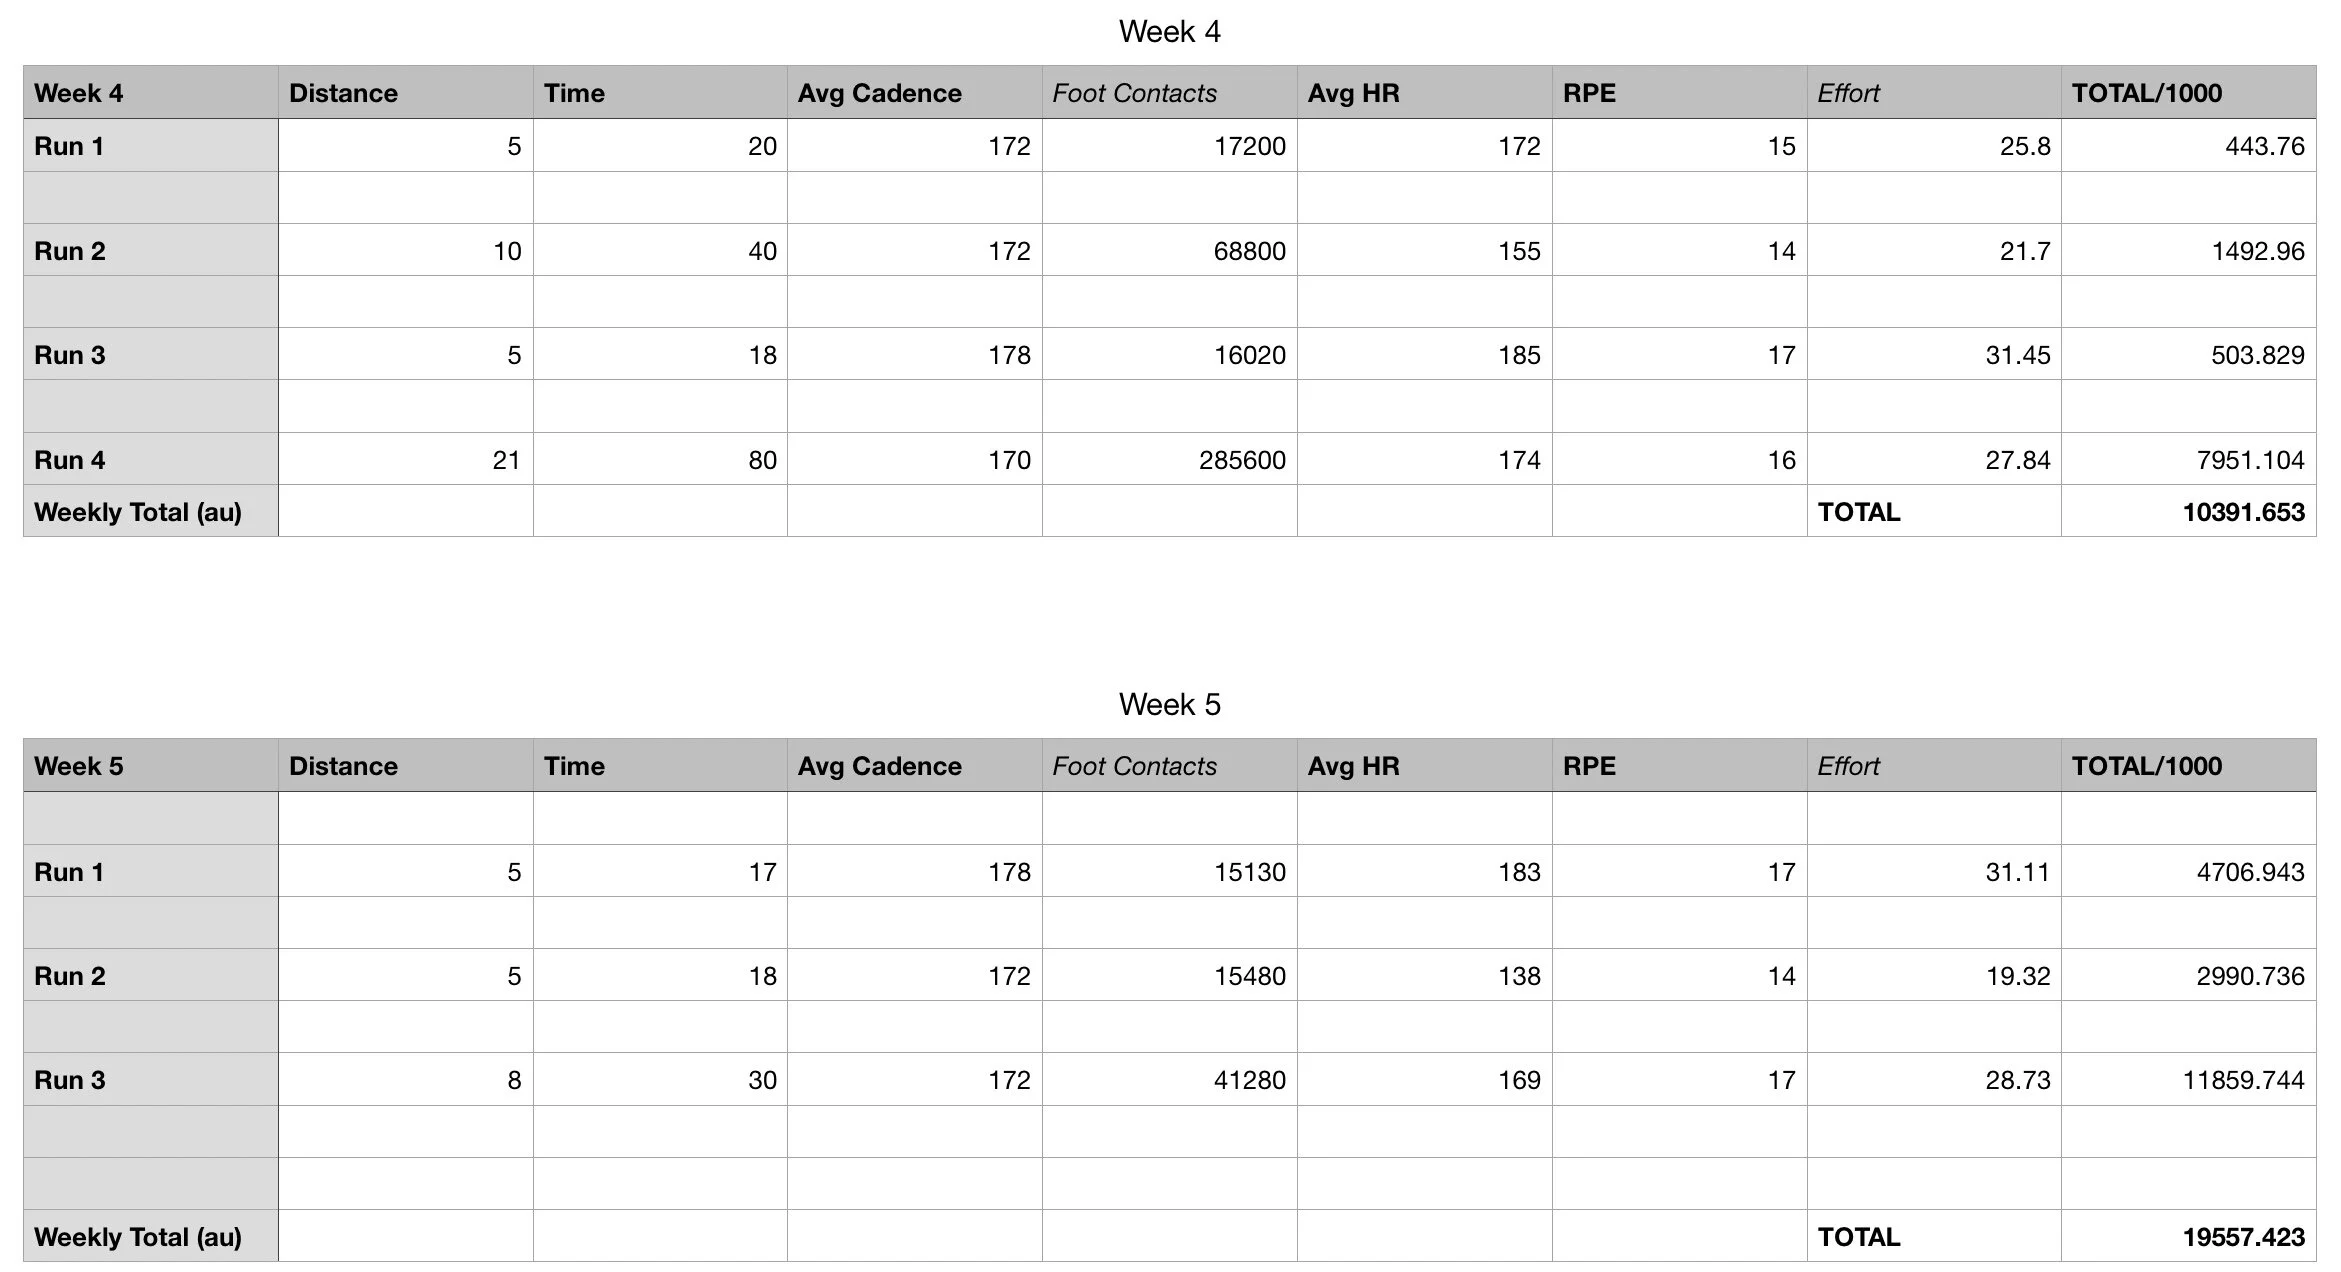
As we have previously discussed, running mileage is not the only factor to consider. Due to the current lockdown I have been running more regularly and with clinics being closed I have free time to look at the data we can collect. The spreadsheet below is an example of some of the data I have collected and retrospectively analysed to see if I can create quantitative figures for different forms of exercise.
Distance measured in km’s
Time measured in minutes
Average Cadence measured in steps per minute
Total Foot Contacts (au) = (cadence x time x distance)
Average Heart Rate
Perceived Exertion (6-20)
Effort (au) = (Heart Rate x Effort / 100)
Total (au) = total foot contacts x effort (divided by 1000 for ease of analysis)
If we consider the the limitations of the simple rolling average acute vs chronic workload equation discussed earlier in the article, it is easy to see how different data indicators (for example cadence and HR) can lead to a change in actionable results (the total arbitrary units at the end of the week). Week 4 included four runs with a total distance greater than that of week 5, leaving a possible acute chronic work load of 0.44 (week 5 divided by week 4). This large drop off in load would lead us to believe it is a low risk week but is that the full story?
Issues arise when we consider other influencing factors during each run, like perceived exertion, HR, cadence, time and distance. It becomes easy to see how different runs can lead to different levels of fatigue on the body. The ‘total (au)’ figure at the end of week 5 is far greater than that of week 4, even though it only included 3 runs and a lower collective mileage. The Acute vs Chronic Workload Ratio is 1.88 (total au of week 5 divided by week 4). This would be considered the danger zone and a high risk of injury. It highlights the need to consider other influencers of fatigue, not just mileage ran. By comparing week-4 to week-5 we are moving towards a model more similarly aligned to The Exponentially Weighted Moving Average. Monitoring each workout across a week and putting a greater emphasis on the week immediately prior, rather than the average of the previous 4-weeks is more sensitive to change. It allows for and acknowledges greater variation in the manner in which loads accumulate (more data) across a week. As we start to include more data indicators, a rolling average model (like the Acute vs Chronic Workload Ratio) that we set out with, may not be sensitive enough to predict injury risk.
This is by no means an evidence based approach, more a way of highlighting the limitations of tracking only your distance in managing the risk of injury. The above example also does not include any strength training fatigue which could also be imputed as an arbitrary unit as discussed above.
As in all articles there is a provision of caution. Monitoring your weekly load does not eliminate the risk of an injury but it is a good starting point. With the current relaxation on exercise frequency you should consider how you progress your exercise loads to reduce your risk of overloading your body and too much too soon (read here) leading to pain or injury.